Feel The Way: Redesigning Emergency Evacuation Maps for Equal Access by the Visually Impaired
We introduce Generalised Emergency Evacuation Maps. A map can be accessed equally by both visually impaired and non-visually impaired individuals.
Project role
UX Researcher
Key skills
Product design
User Research
Accessibility
Timeframe
Feb 2022 - Apr 2022
Context
Evacuation directional maps are essential for people to find their way out of a building in emergency situations. Therefore, Taiwan’s Public Place Safety Regulations require them to be installed in public places.
Blind people are more vulnerable than sighted people in such situations; however, most emergency evacuation maps are designed only for sighted people. Most public safety guidelines advise blind people to stay put during emergencies and wait for assistance, which often leaves them in a passive position and without agency.
"Most government guidelines advise blind people to stay put during emergency situations and wait for assistance. Honestly, I don’t feel safe relying on this"
Interview quote from a visually impaired participant
How Might We
How might we create equal escape opportunities for blind people in emergency situation?
There are already some tactile evacuation maps designed for blind users, which use textures to help blind users read. However, there are 2 problems:
- Problem 1. Design relies on textures and Braille, which is unintuitive for sighted users
- Problem 2. Limited installation: Since those map are specifically for blind user, They typically installed only in locations frequented by the visually impaired, such as special schools.
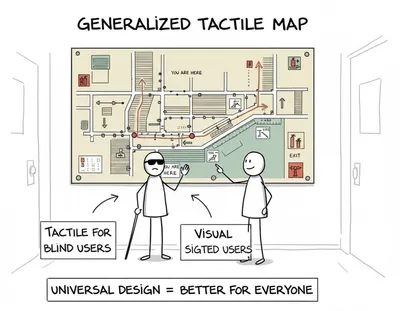
one evacuation map usable by both blind and sighted users
By integrating both tactile and visual elements into a single map, we aimed to create a solution that can be intuitively used by both sighted and blind people. This approach avoids treating accessibility as a special add-on, and instead makes it a default feature—ensuring that everyone shares the same information, in the same space, especially in emergency situations where equality can be a matter of survival.
Prototype
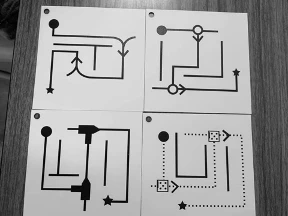
Designing a universal evacuation map sounds simple, right? We just need to add Braille to the text and raise the lines. With this in mind, we created our first prototype:
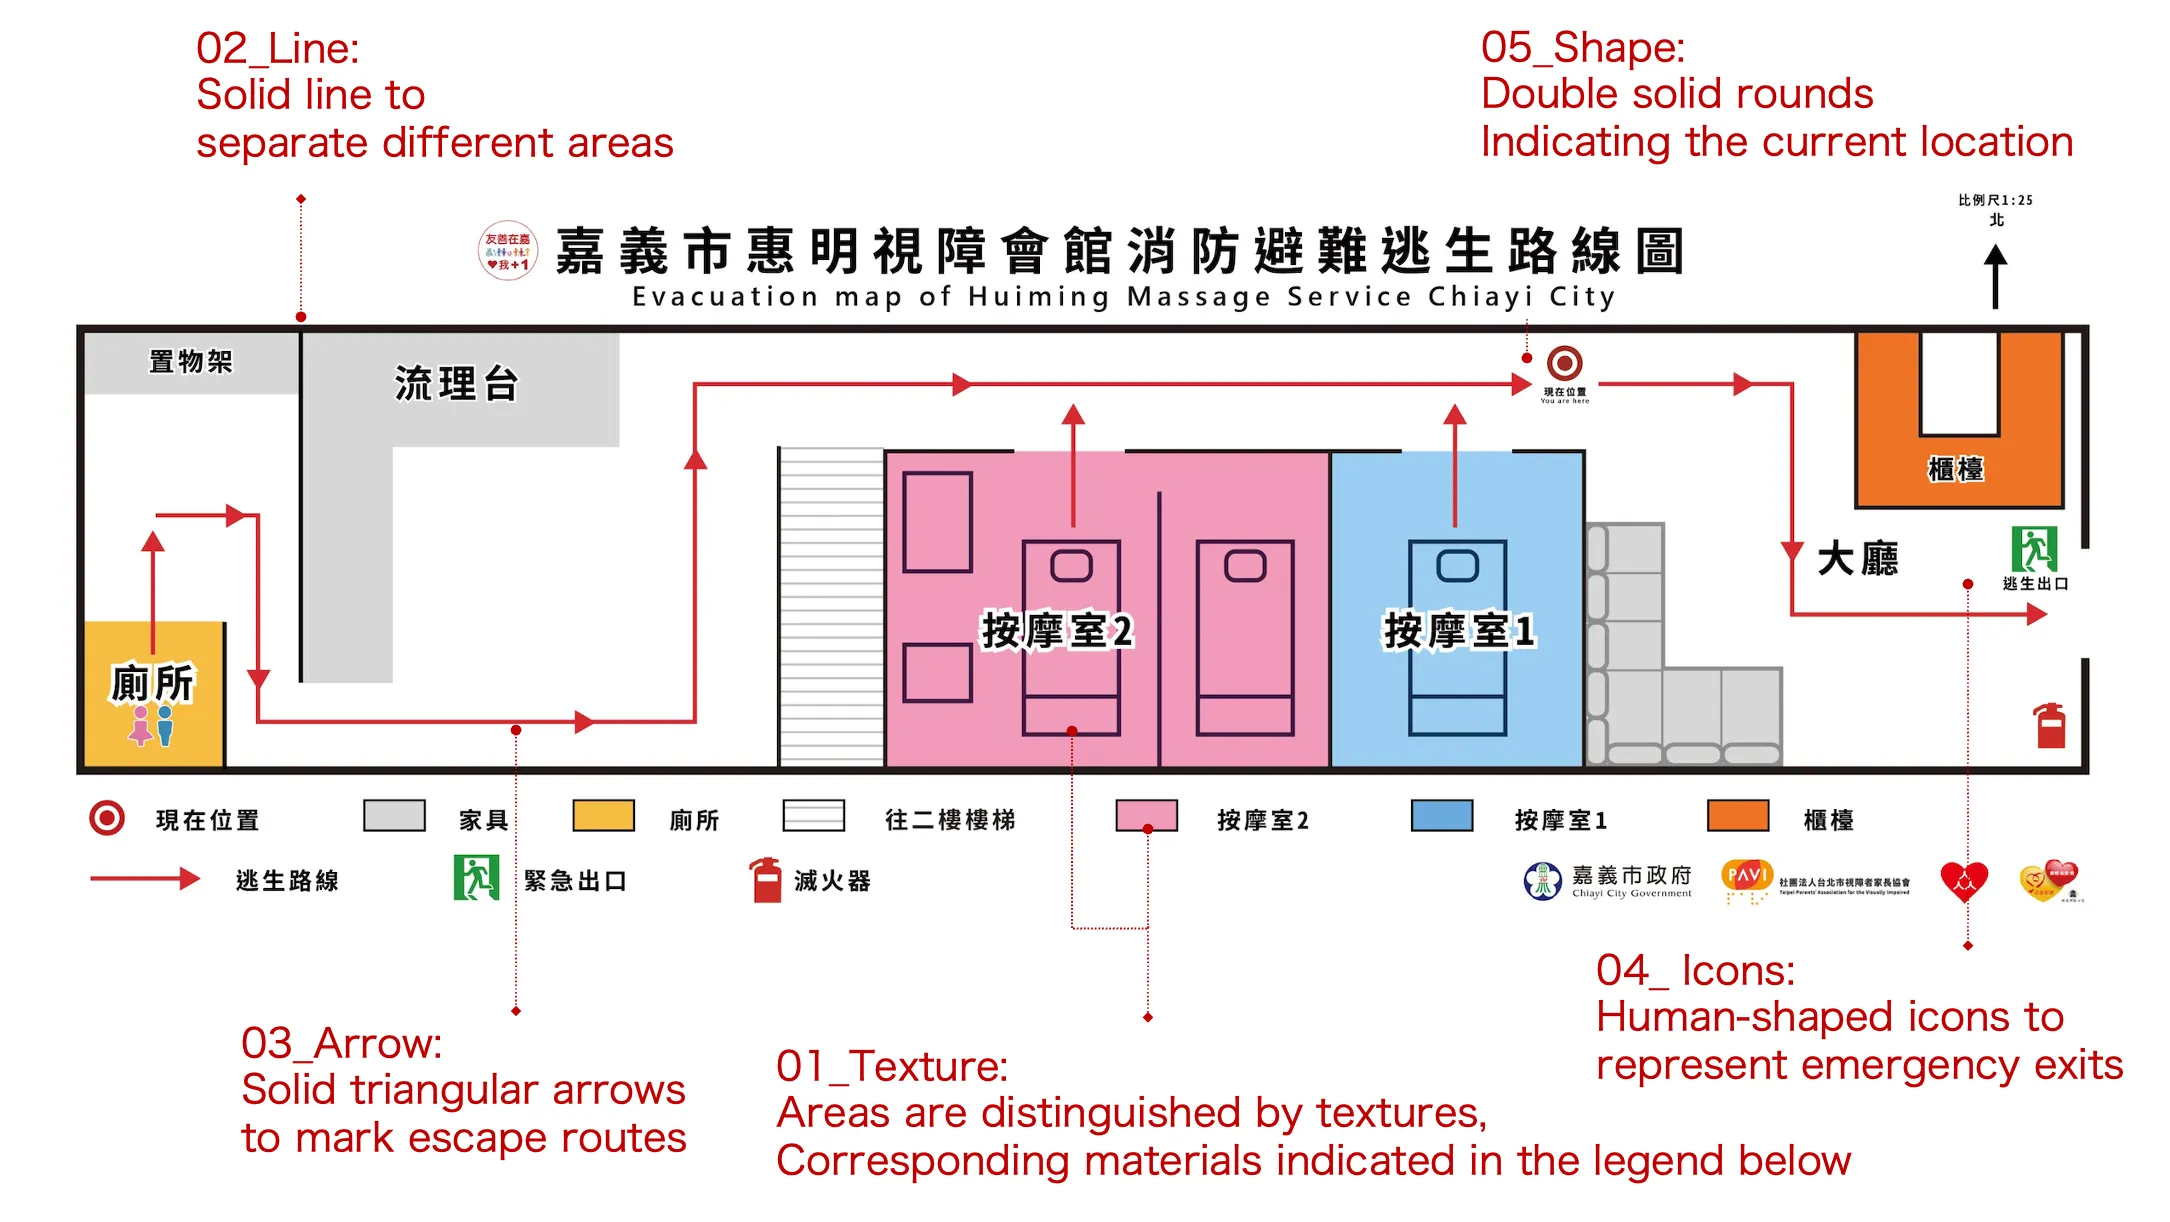
- Integrated tactile elements (textures, shapes, and lines) with traditional visual map designs.
- Used a 3D printer to create map prototypes.
User Testing
However, when we tested it with visually impaired users, we found that they could not use it efficiently.
Which line indicates the evacuation route? Which line is just decoration or part of the wall? We made a lot of icons raised, such as female/male toilets and emergency exits, but when they went through them with their fingers, they simply went through them without noticing them.
Most blind users with congenital blindness can recognise Braille without effort, but for those who lost their sight after becoming adults, it is time consuming.
So we realised that:
Not all blind people know Braille, and simply transforming a traditional map into a tactile map is not enough. We need to find a way to design it to meet people’s intuitive tactile perception.
Quantitative: Experiment Design
The main challenge is: How to quantify the intuitiveness of a evacuation map? And how to convert it into a practical design guideline?
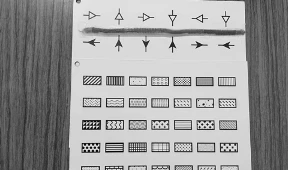
We categorized map elements into 6 groups: texture, line, arrow, icon, shape, and corner. Afterwards, we design a experiment for each element.
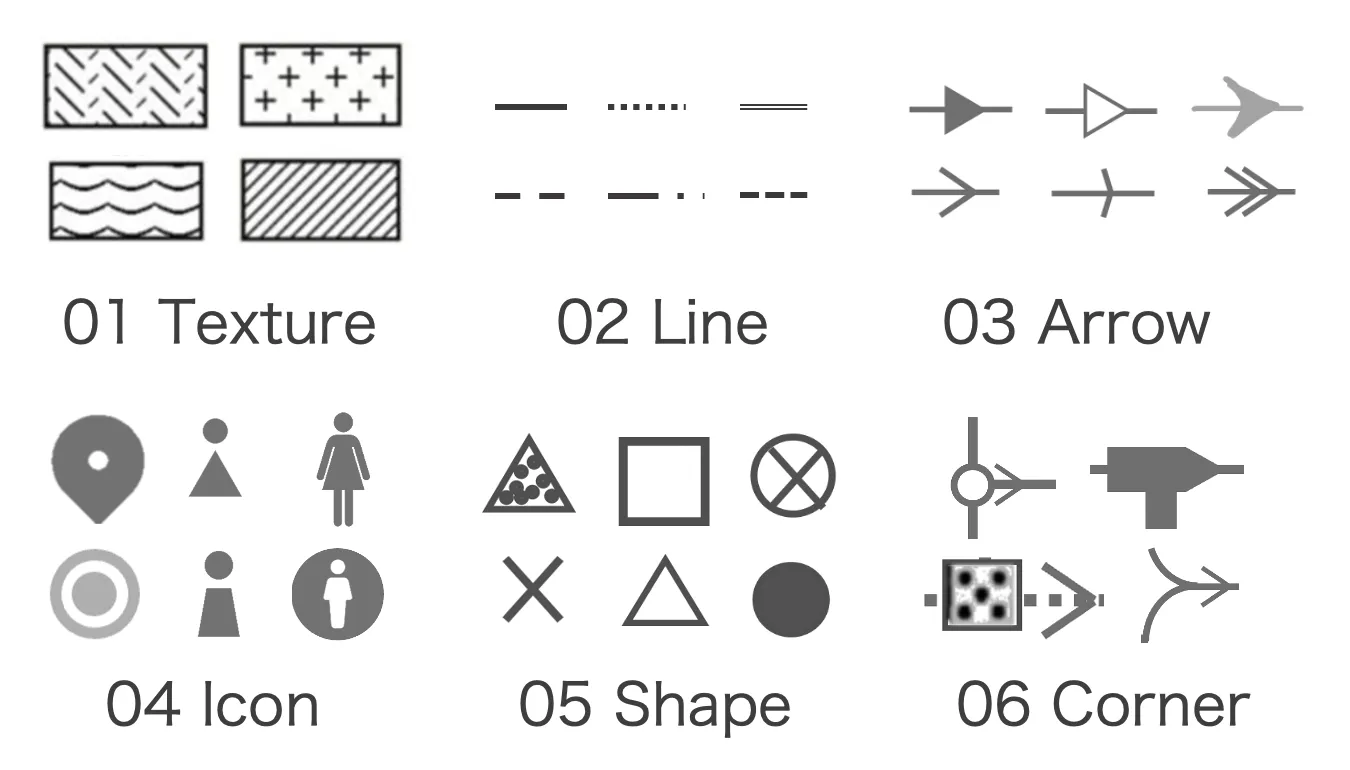
6 catagories of tactile map elements
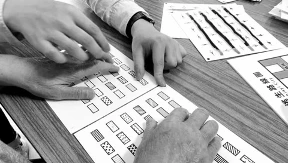
Because of NDAs with the organizations involved, I can’t show the exact designs or experiment results The image below, however, demonstrates the test boards used for each map element, giving an overview of the research setup:
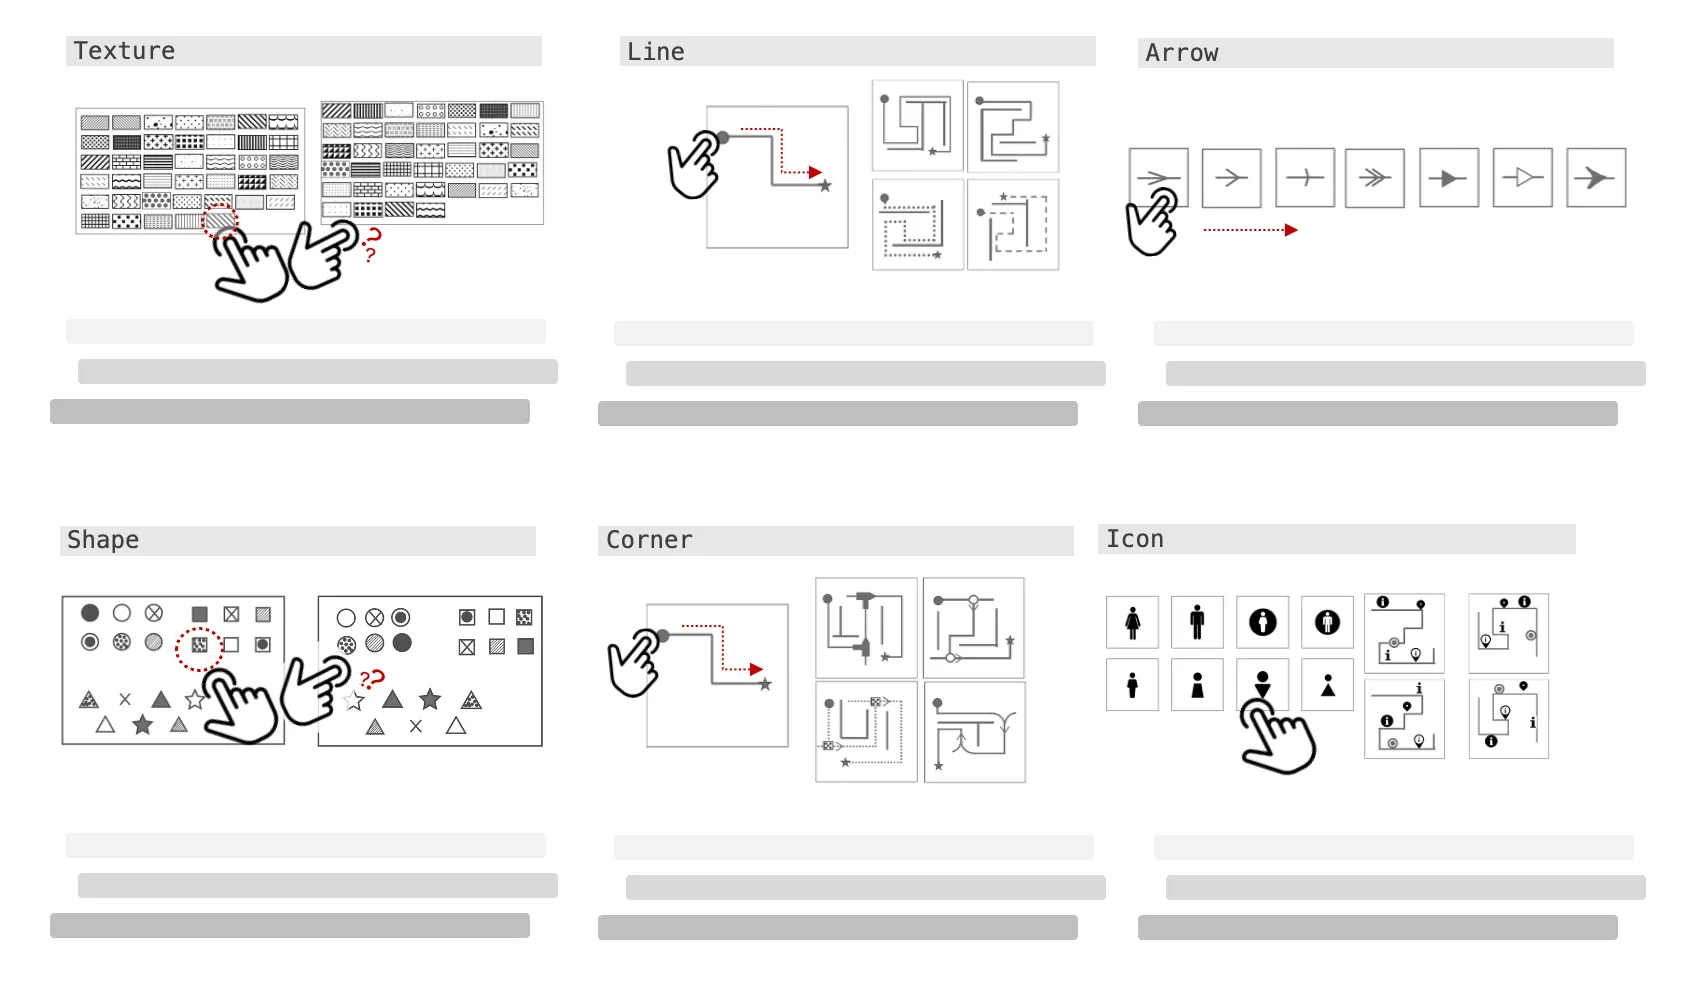
the experiment test broad for each element
In total, we recruited 36 visually impaired participants, which is the largest sample size in similar studies in Taiwan, and it is also rare internationally.
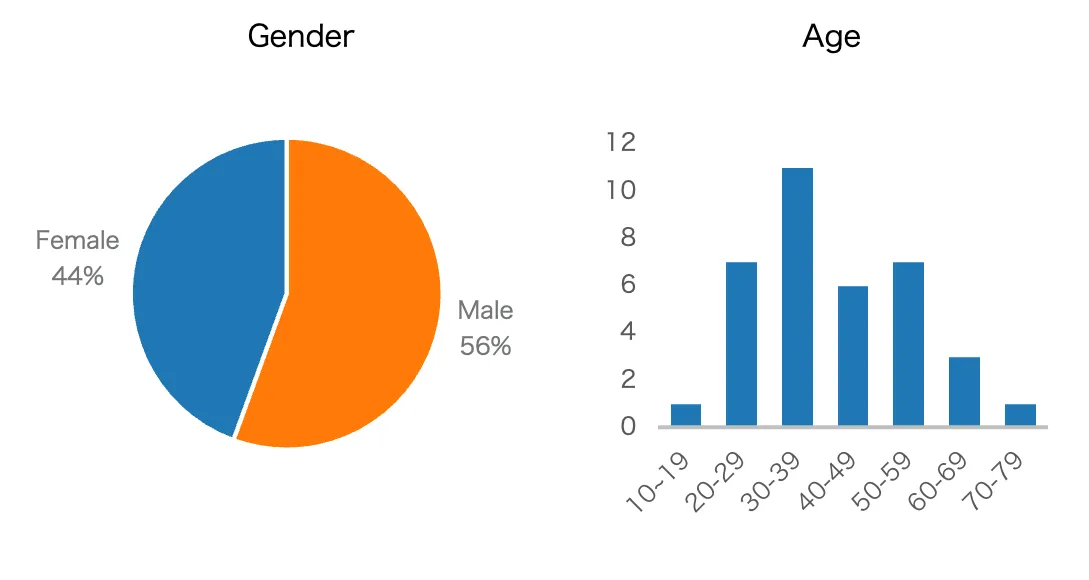
Age and gender distribution
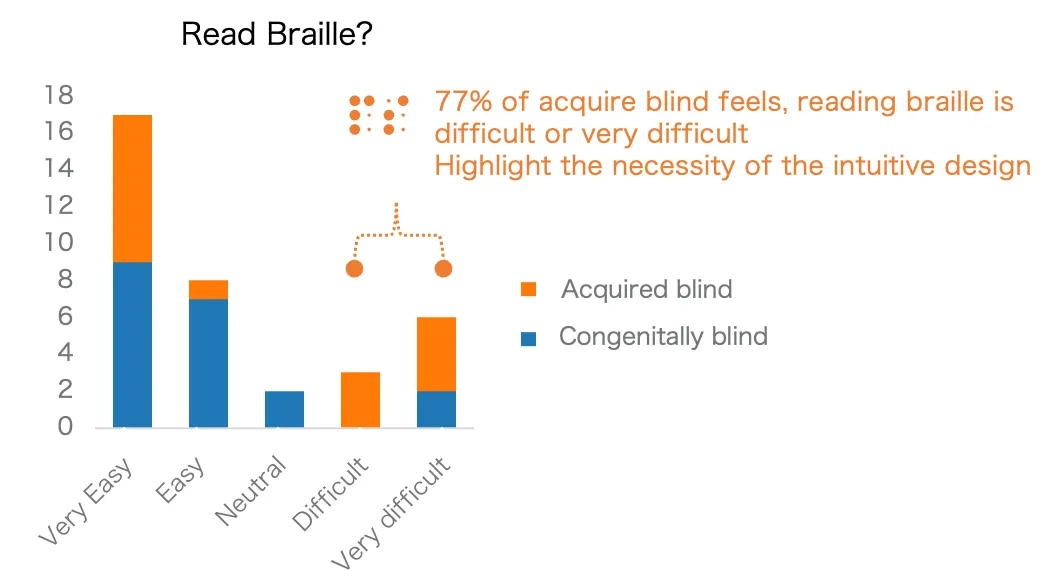
Distribution of congenitally and aquired blind participants
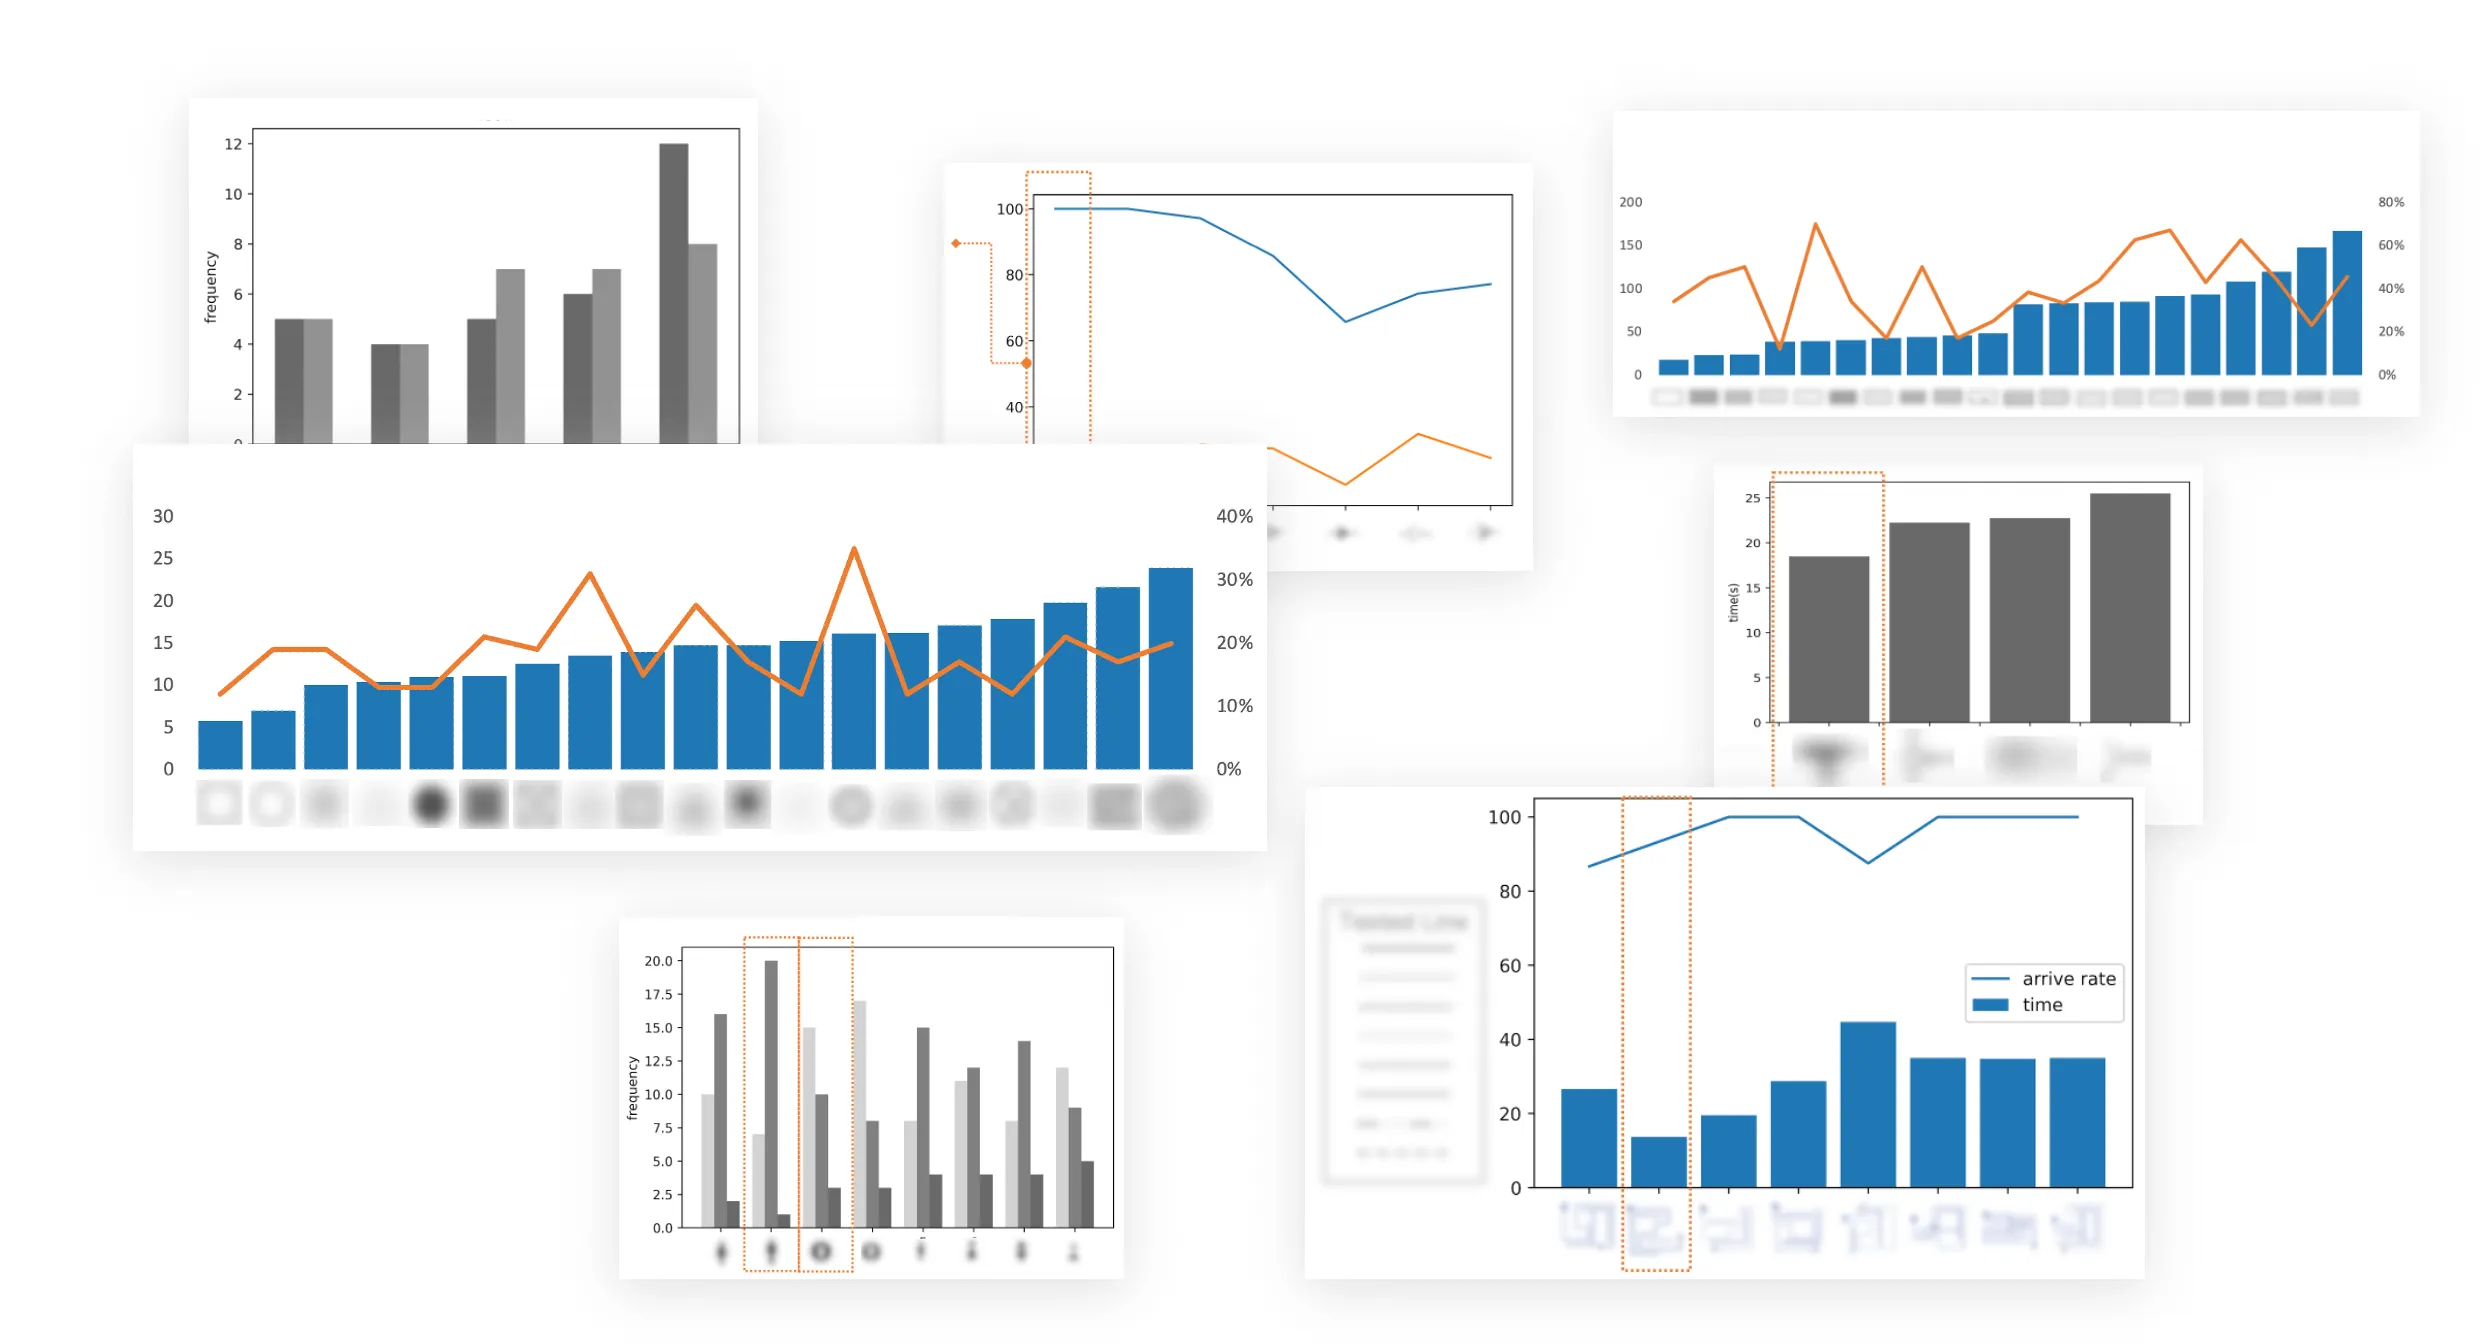
Data visualization for experiment results
Qualitative: Interview
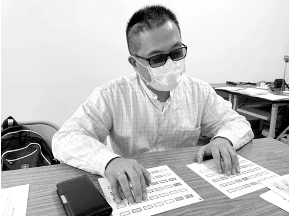
We conducted semi-structured interviews to understand what made each test easy or difficult. More importantly, we designed the sessions so participants felt empowered, included, and connected throughout the process.
"The simpler the lines, the better. Tactile resolution cannot distinguish subtle difference between dashed lines"
Participant No.3: Interview after line experiment
"The textures within shape is confusing. Should I focus is on feeling the shape, the texture, or something else?"
Participant No.11: Interview after shape experiment
Most of our finding is similar with previous work suggested (Wabiński et al. 2022), for example:
- The internal patterns of the texture should be as simple as possible
- Textures should not be too dense or intricate, as tactile resolution cannot distinguish overly fine details.
- The number of different textures used in a single map should be limited to avoid cognitive overload.
Impact #1: Inform Public Policy
The results of the experiment provided to Taiwan’s National Fire Agency as reference to establish guidelines for tactile evacuation map design.
Taiwan’s National Fire Agency
Impact #2: Real-World Implementation
Our research findings were presented and adopted by related advocacy groups in blind people welfare. Thanks to the efforts of these organisations, government agencies and local NGOs, the first generalised tactile evacuation maps were installed at Moon Peach Story House, a tourist spot in Taiwan with over 400,000 visitors per year.
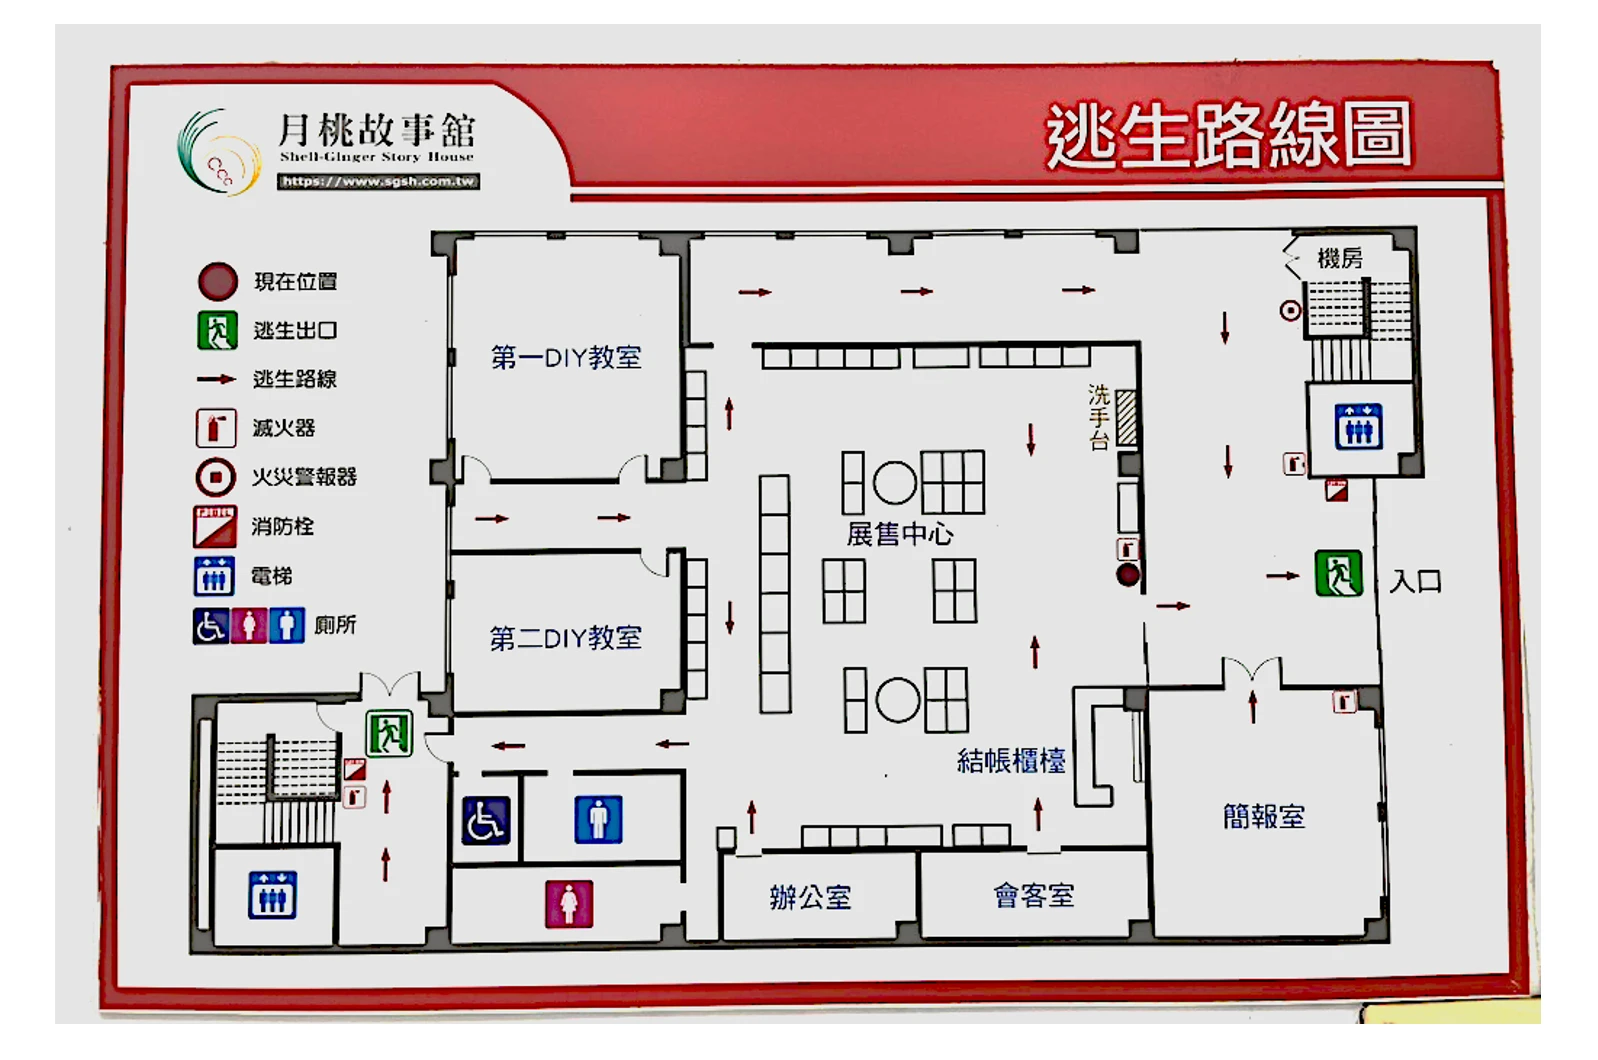
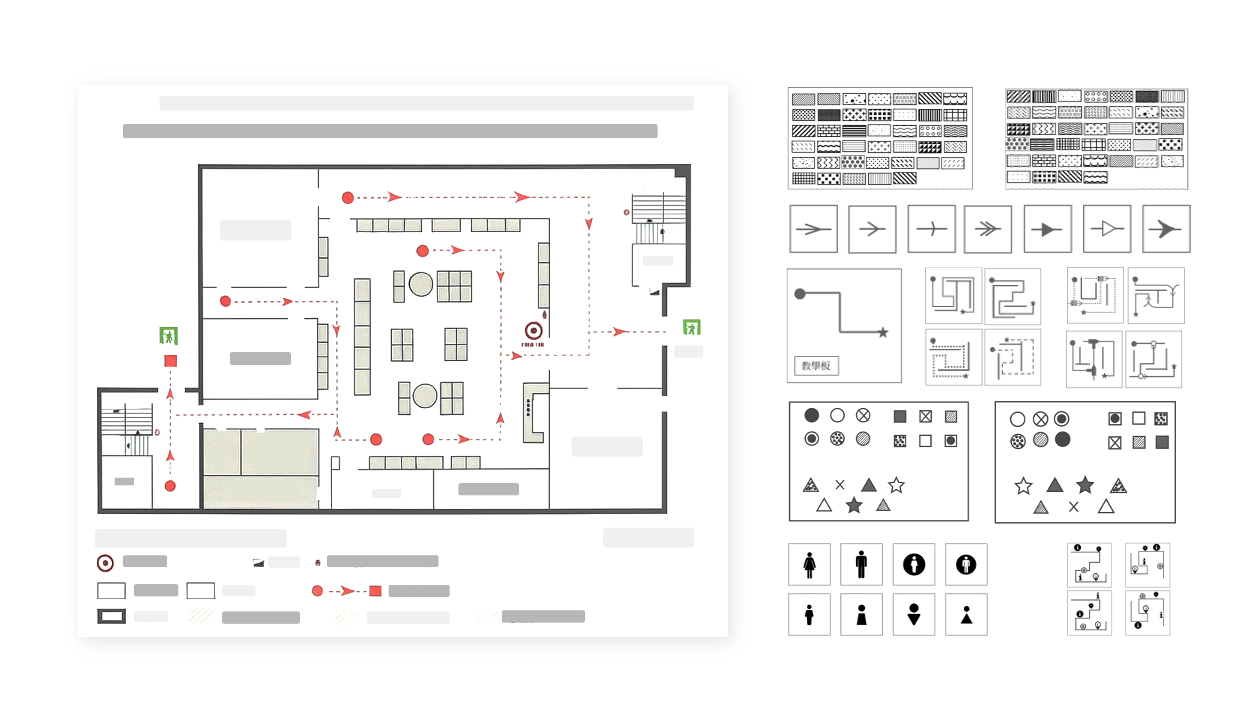
Original 2D designed map
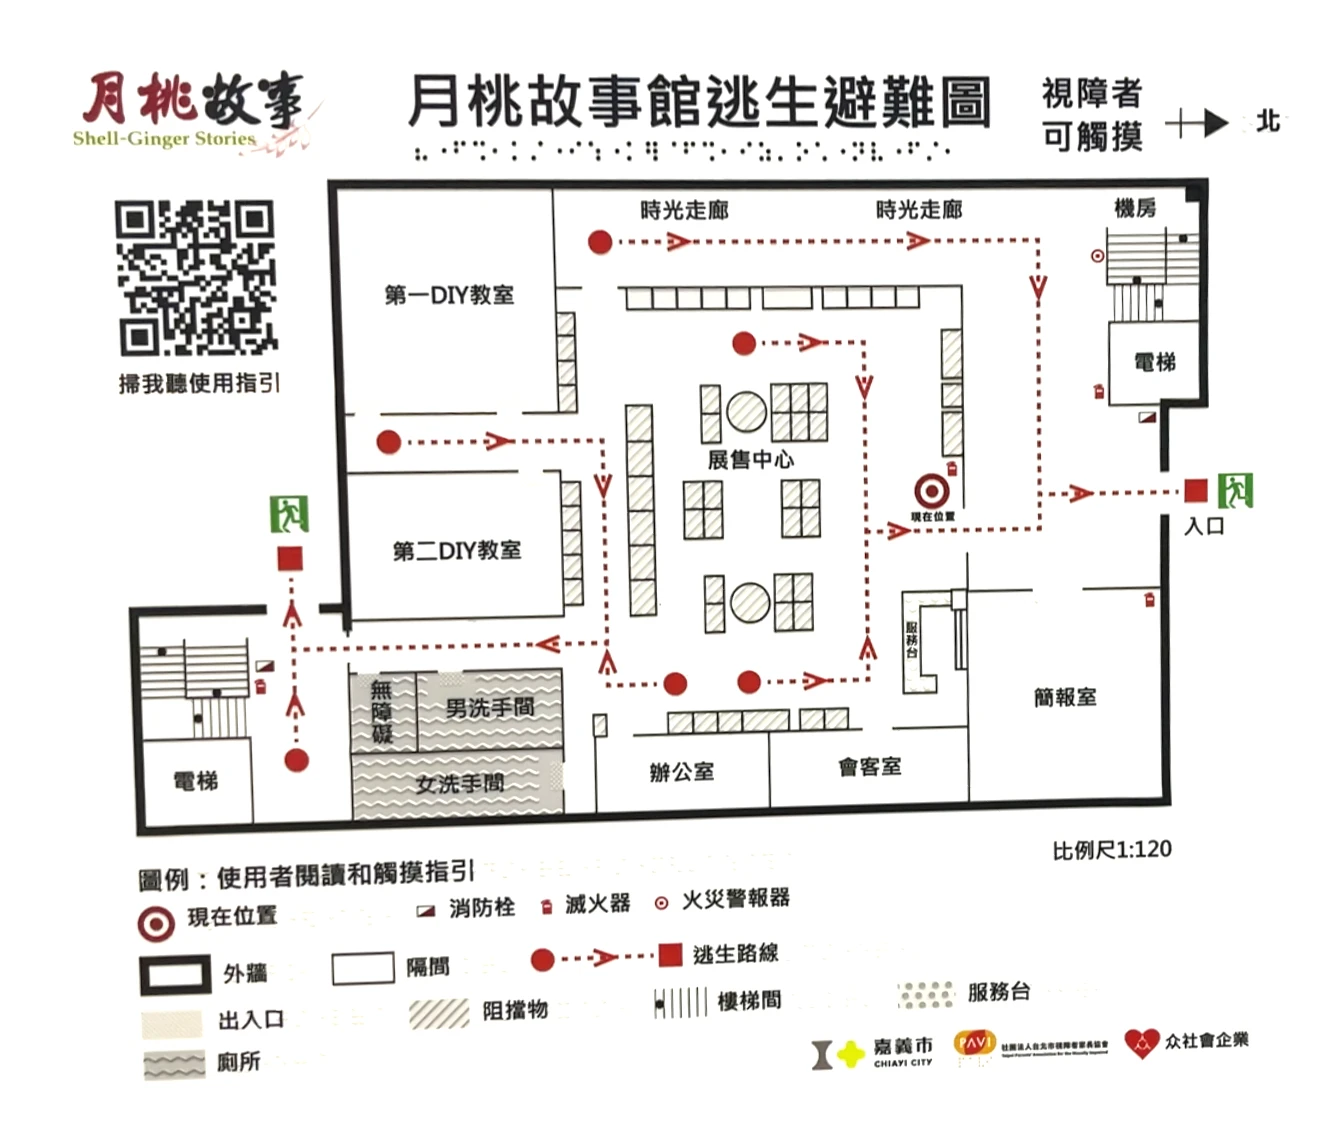
Designed applied our research findings
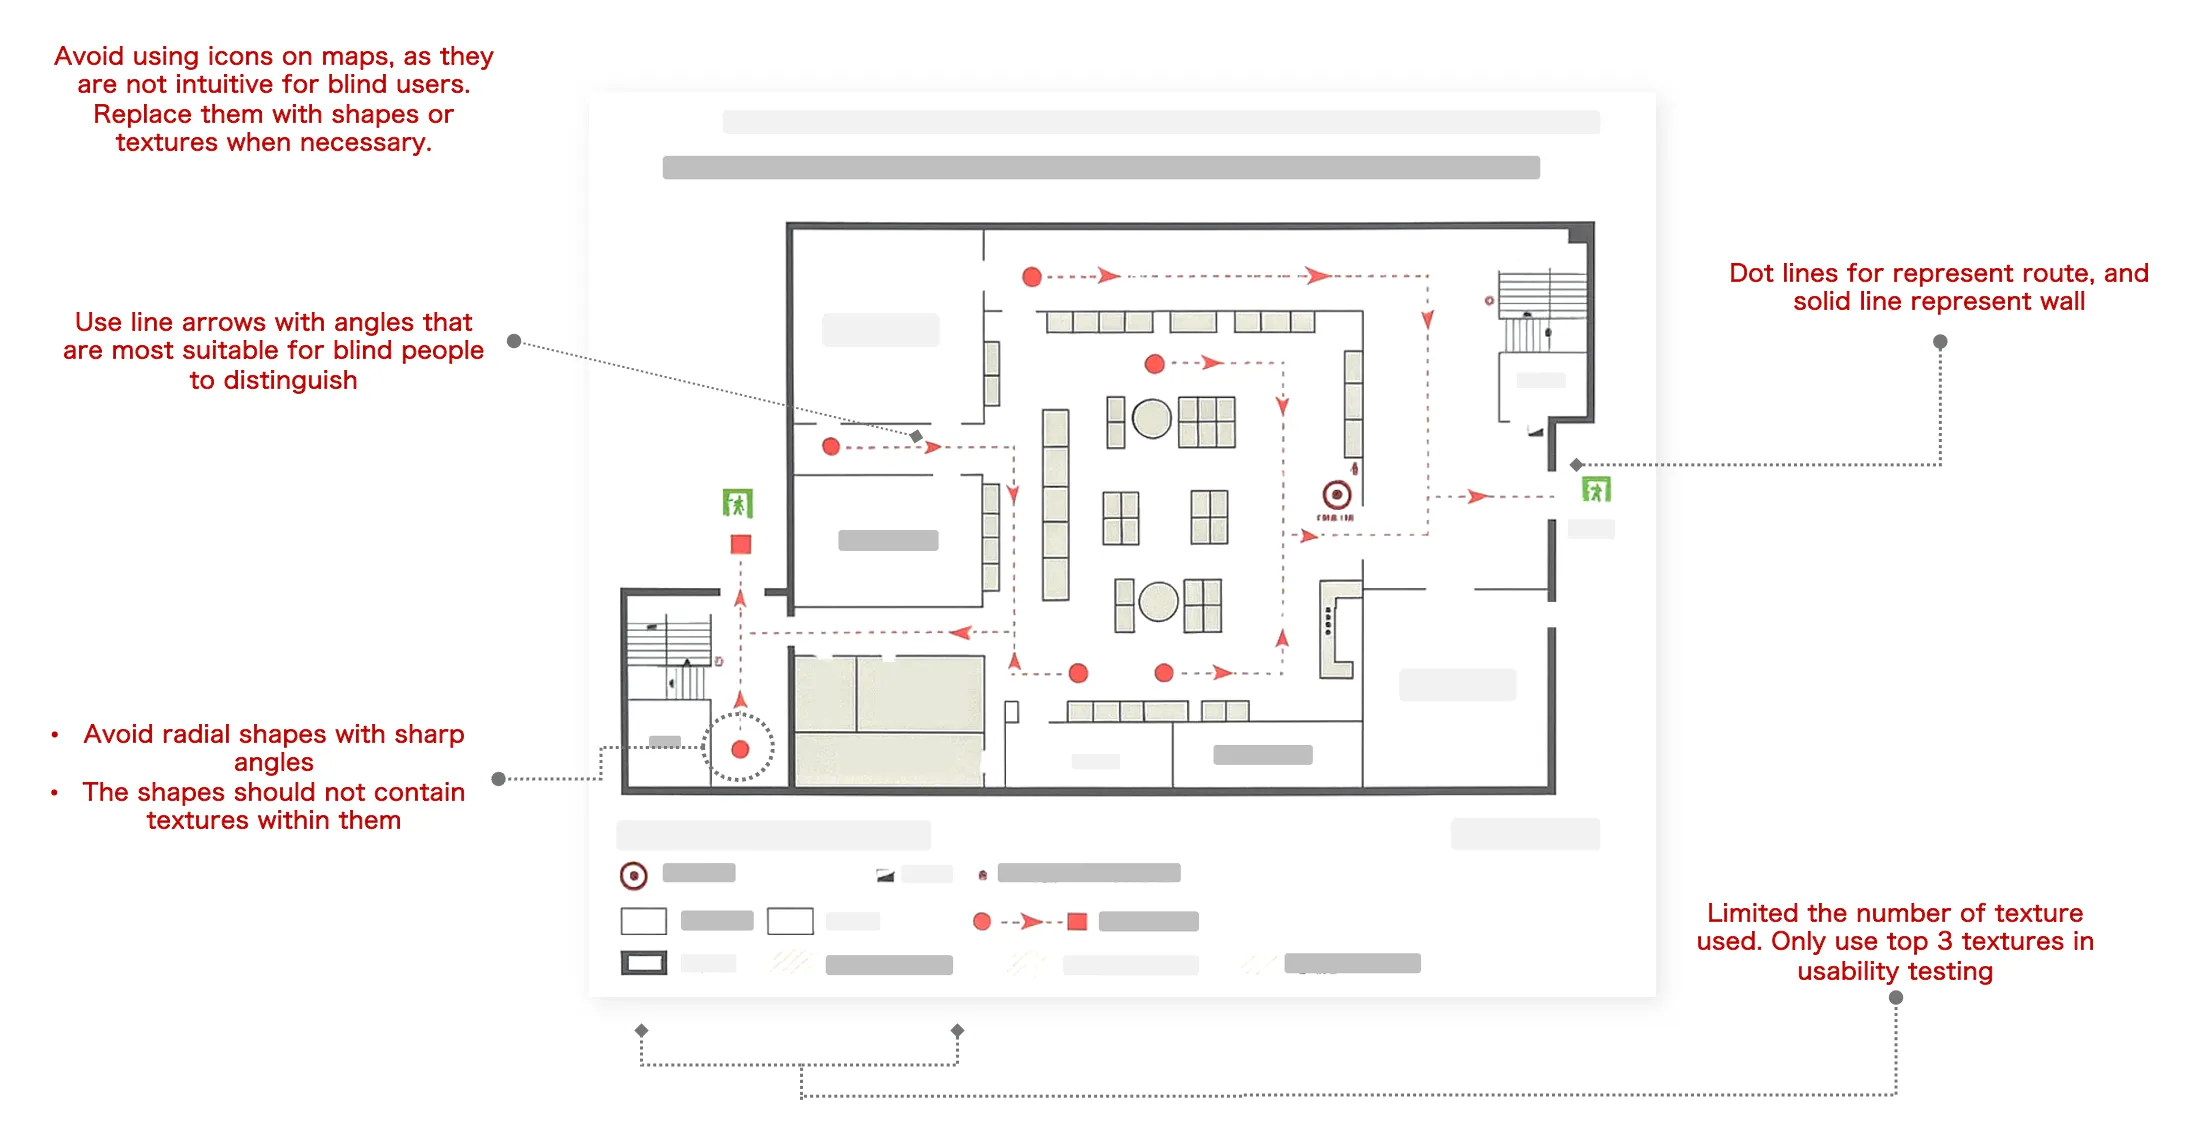
A note explaining the new tactile evacuation map design
Some final thoughts…
Before this project, I mainly worked for academic research. It gave me a deep-rooted belief that a “good research” should have large-scale datasets and complex statistical models: the bigger and more sophisticated, the better.
This project makes me realize that how research can be very different: isn’t just about methodology; it’s about participatory processes. Through continuous engagement with stakeholders, users, and government agencies, we shape the future we want. The key is not just producing evidence, but creating spaces for dialogue where stakeholders can shape the solution they need.
References
Wabiński, J., Mościcka, A., & Touya, G. (2022). Guidelines for Standardizing the Design of Tactile Maps: A Review of Research and Best Practice. The Cartographic Journal, 59(3), 239–258. https://doi.org/10.1080/00087041.2022.2097760